Stock Prediction using Prophet (Python)

Prophet is a procedure for forecasting time series data based on an additive model where non-linear trends are fit with yearly, weekly, and daily seasonality, plus holiday effects. It works best with time series that have strong seasonal effects and several seasons of historical data. Prophet is robust to missing data and shifts in the trend, and typically handles outliers well.
Introduction
Prophet from Meta (Facebook) is a forecasting procedure implemented in Python. We can use it to predict time series data. Since stock prices are time-series data and as we can easily get historic data, let's create a python script to predict US Stock prices.
Acquiring Stock Prices
Yahoo Finance has a Python library that can be used to fetch stock data based on the stock ticker. Yahoo Finance library can be added using
pip install yfinancethen to fetch all available data on let say Apple Inc [AAPL], we run the following code

we need only the close price so, we discard other columns, by using
hist = hist[[‘Close’]]

Now, Date is the index, we need to convert it to a column using reset_index, and also have to rename the columns to ds for timestamp and y for the value field, as per the Prophet requirement

now we have stock data, that can be passed to Prophet
Prophet
It can be installed by
pip install prophetA new Prophet object can be initiated using
m = Prophet()Any forecasting procedures are passed into this constructor, Prophet will by default fit weekly and yearly seasonalities, let's enable daily seasonalities.
m = Prophet(daily_seasonality=True)Then we call the fit function and pass the historical data frame,
Note: The historical data frame should contain two columns, a timestamp column titled ds and a value column titled y.
m.fit(data)A data frame with future predictions can be obtained by, where periods is the number of days.
future = m.make_future_dataframe(periods=365)To summarise, adding these to our existing codes will be as follows

we can filter to the required data using
print(forecast[['ds', 'yhat', 'yhat_lower', 'yhat_upper']].tail())
Plotting
Prophet has a built-in plot method that can be called using,
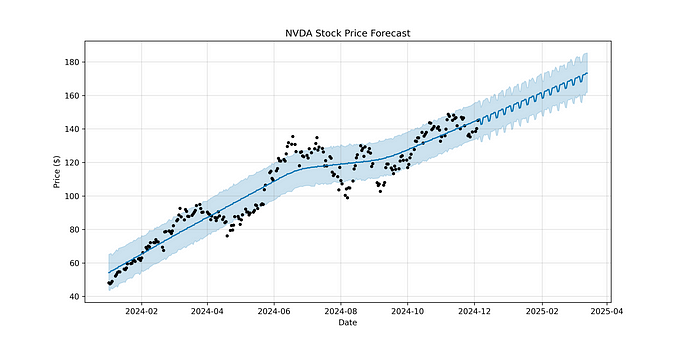
figure1 = m.plot(forecast)
figure2 = m.plot_components(forecast)
The following code would give a more interactive plot
from prophet.plot import plot_plotly, plot_components_plotlyplot_plotly(m, forecast)Final Program